Hybrid Poplar Growing in Plantations -
Growth Responses to Alternative Establishment Systems
Tree performance

|
Tree performance was assessed for 12 individually marked trees for each experimental unit, containing 6 trees for each clone ‘Walker’ and ‘Okanese’ for both growing seasons 2012-2013. Initial height and diameter measures were taken in June 2012 at the time of planting. All assigned trees were tagged and marked permanently at 3 cm height above ground to allow for repeated measures of basal diameter. Basal diameter was taken 3 cm above ground in two directions (N-S and W-E) using a digital caliper held at right angle and measuring to an accuracy of two decimal places. Height was measured with a meter stick from ground level to the apical bud or to the end of the growing tip where no bud was formed. Tree saplings were straightened out to get a precise height measure. Tree height and diameter growth increments were recorded in October 2012 and 2013 using the same method as for initial tree measures. Relative height and diameter growth increments for each season were calculated by dividing the final maximum growth measure in fall by the initial measure in spring for each season.
|
Herbaceous vegetation
|
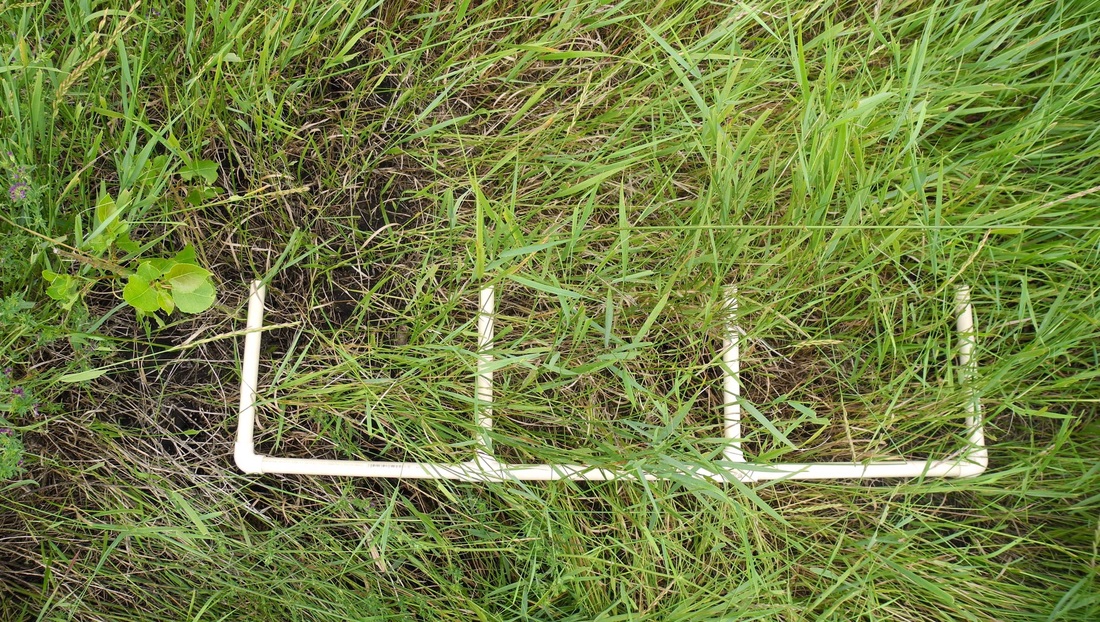
Herbaceous understory vegetation was quantified annually between late July and early August 2012 and 2013 using a belt transect with three contiguous quadrats (25cm wide x 35cm long) along a 105 cm long transect line. Quadrats were sampled at three distances from 0-35 cm, 35-70 cm, and 75-105 cm from the tree base at all four cardinal directions for all living experimental trees in 2012 and for a randomly selected subset of maximum three living trees per clone and treatment in 2013. All species of vascular plants were identified in each quadrat and percent cover (0-100) of above-ground parts of each species was visually estimated within 0.05% for estimates up to 20%, and within 0.1% for estimates above 20%. Total cover estimates per quadrat could add up to more than 100% due to overlap.
|
|
Environmental Variables
Soil nutrient availability
Plant Root Simulator (PRS) probes containing ion exchange resin membranes (Western Ag Innovations, Inc., Saskatoon, Canada) were installed in the second growing season 2013 to measure nutrient supply rates of NO3--N, NH4+-N, P, K, S, Ca, Mg, Mn, Al, Fe, Cu, Zn, B, Pb and Cd. A total of eight pairs of PRS-probes with one anion and one cation probe each were inserted vertically at two different distances in each of the four treatment plots within each block exclusively for hybrid poplar clone Okanese, for a total of 124 PRS-samples (15 blocks x 4 treatment plots x 1 clone x 2 distances + 4 additional treatment plots). Four pairs were placed at 20 cm distance to the base of a subset of four trees at the side of the tree facing the main alley (North or South) and four pairs equally spaced along the center of the main alley. The probes were buried for a period of nine weeks starting May 28 until July 27 between maintenance applications to prevent damage of probes through equipment. Nutrients for which the majority of values were below the MDL were Cd, Cu and Pb and therefore not analyzed. Further, the nutrients B and Al were excluded from analysis due to incomplete displacement of these ions during probe regeneration for a subset of probes used in this study.

|

|
PAR transmittance
|
Photosynthetically active radiation (PAR; 400–700 nm) was measured in June, July and August of 2013 during a two-hour period around solar noon when weather conditions were stable (either clear sky or completely overcast), using a 80 cm long linear ceptometer (AccuPAR, Decagon devices, Inc., Pullman,USA). Four instantaneously taken measurements were averaged for each of three sampling locations for each tree in each clonal block and treatment, for a randomly selected subset of maximum three living trees. Sampling locations were 1) above tree and weed canopy for an unobstructed sky view, 2) above the weed canopy at the mid crown of the tree for a measure of the tree impact on surrounding understory, and 3) within the weed canopy at the vertical midpoint of the portion of the tree crown that was shaded to measure the effect of competing vegetation in reducing light for the affected tree portion. To compare between sampling periods of differing weather conditions and growth the relative PAR transmittance (%) of each sampled vegetation layer was calculated as the proportion of PAR measured within each respective plant canopy to the instantaneous PAR measure above the plant canopy.
|

|
Soil water content and soil temperature

|
Volumetric soil water content (%) was measured at 5 cm depth in August 2012 and in June, July, and August of 2013, at least two days after substantial precipitation, with a ML2x ThetaProbe soil moisture sensor attached to a HH2 moisture meter (Delta-T Devices, Cambridge, UK). In each clonal block per treatment, measurements were taken at two distances from the tree bole (20 cm and 40 cm) at both the North and South side, for a randomly selected subset of maximum three living trees as well as two measurements equally spaced along the center of the main alley. The two measurements per distance were averaged prior to analysis to obtain values for locations close and far from the tree bole and the main alley. Peak soil temperature (°C) measurements were conducted at 5 cm soil depth in August 2012 and in May, June, and July of 2013, between 14:00 and 16:00 MDT, using a 450ATT digital soil thermocouple thermometer (Omega, Laval, PQ, Canada) following the same method used for soil water content.
|
