Hybrid Poplar Growing in Plantations -
Growth Responses to Alternative Establishment Systems
Data Analysis
All statistical analyses were performed using the “R” software (R Development Core Team 2012) and SAS 9.2 (Sas Institute Inc., Cary, NC).
Treatment effects on hybrid poplar growth
Clonal differences in poplar seedling mortality were tested with two-sample Z-tests for each sampling time, using the R package corpora. Chi-square tests were used to compare seedling mortality among the four establishment systems. Survival percentages were provided for the Z-tests while survival counts were used for the chi-square tests. Mixed-model ANOVA’s were computed to compare the effects of establishment systems on growth of the two hybrid poplar clones, using the SAS procedure for mixed linear models (proc MIXED). The final model included seedling basal diameter as the dependent variable, and establishment system (business-as-usual, cover crop, fallow and no-till), type of clone (Okanese, Walker) and the interaction between establishment system and clone as fixed factors. Block was included as the random term. Initial seedling size, i.e. cutting basal diameter, was included as a covariate to account for variation in seedling size at the time of planting thereby increasing the power of the test to detect differences among treatments. Type of site could not be included in the model because different sites were not replicated in this study. However, graphical data exploration was used to explore differences among sites.

Table 2: Sample data table showing experimental design structure (site, block (BLK), plot, treatment (TRTM) and clone) and tree performance variables (survival in falll 2012 and spring and fall 2013 (i.e. SURV0513), initial cutting basal diameter (DINIT0612), relative diameter increment in the first and second establishment year (DINC12, DINC13) and cumulative two-year diameter increment (DINC1213).
|
After two growing seasons, large differences in hybrid poplar seedling survival and growth were observed. Overall survival at the end of the second growing season was high for the Okanese clone (89 %) and low for the Walker clone (39 %) (Figure 4). Survival between clones did not differ after the first growing season (p = 0.68) but after the first winter 2012/2013 (p < 0.001) and the second growing season (p < 0.001). Both clones showed good survival at the end of the first growing season (Okanese 96 % and Walker 97 %). While survival of Okanese remained high after the first winter (93 %) and at the end of the second growing season (89 %), this was not the case for Walker. Walker showed a 30 % decrease in survival after the first winter (67 %) and a further 28 % decrease at the end of the second growing season (39 %). Establishment systems did not differ significantly (p > 0.05) in their effect on hybrid poplar survival for any time period. |

Figure 4. Lineplot showing survivival (%) of Okanse and Walker from 2012-2013
|

Figure 5. Boxplots showing diameter increment grouped by treatment and clone for (a) 2012, (b) 2013 and (c) 2012-2013.
|
Clonal differences were also observed for both height and basal diameter growth. Okanese showed significantly better growth (p < 0.001) compared to Walker (Figure 5). Clonal differences in growth were already present after the first growing season. Within each clone, height and diameter growth also differed (p < 0.001) between the different establishment systems and the control (Figure 5). After two growing seasons, Okanese showed the best growth in the extended fallow system, followed by the business-as-usual, no-till and cover crop systems. Noticeably, the fallow system produced seedlings with almost 80 % greater diameter growth (p < 0.001) compared to the current business-as-usual system. Comparing both less intense treatments with the control, Okanese seedlings showed an almost 40 % decrease in diameter growth (p < 0.001) when grown in plots interseeded with cover crops while diameter growth only decreased by 20 % in no-till plots (p > 0.05). After the first growing season, growth differences were greatest between the more intense establishment system and the less intense systems, i.e. fallow compared to both no-till and cover crop. Differences among the two more intense treatments fallow and business-as-usual only became evident after the second year. Interestingly, the no-till treatment did not differ significantly compared to the control in any year. For Walker, best growth was obtained in the following order: fallow = business-as-usual > no-till = cover crop. Noticeably, significant differences for Walker were only found when comparing both business-as-usual and the fallow treatment with cover crop and no-till during both years, indicating that treatment differences were less pronounced for Walker than Okanese. Tree performance also differed between sites with differences being more pronounced on the lowland site compared to the upland site (Figure 6). |
|
|
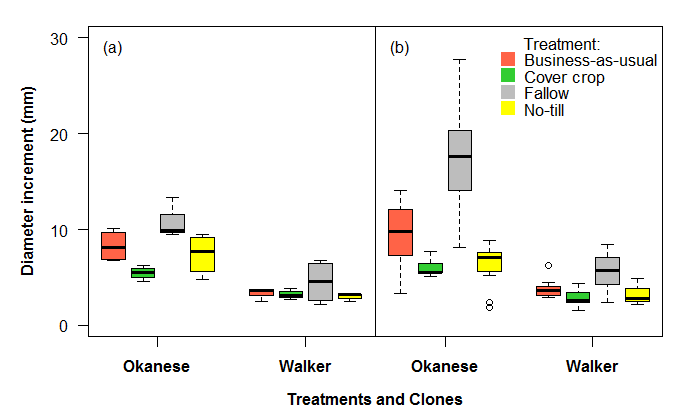
Figure 6. Boxplots showing diameter increment grouped by treatment and clone for (a) Lowland and (b) Upland.
|
Understory community
Significant effects of establishment system, clone and the interactions thereof on the understory vegetation community among treatments were tested with permutational multivariate analysis of variance (perMANOVA) using the R package vegan with the adonis() function. When significant differences were found, post-hoc pairwise comparisons were performed using a Bonferroni adjustment (α/ # of comparisons) to control the family-wise error rate. For example, for comparisons among establishment systems a Bonferroni-adjusted α-value of padj= 0.05/6= 0.008 was used.

Table 3: Sample data table showing understory vegetation community data.
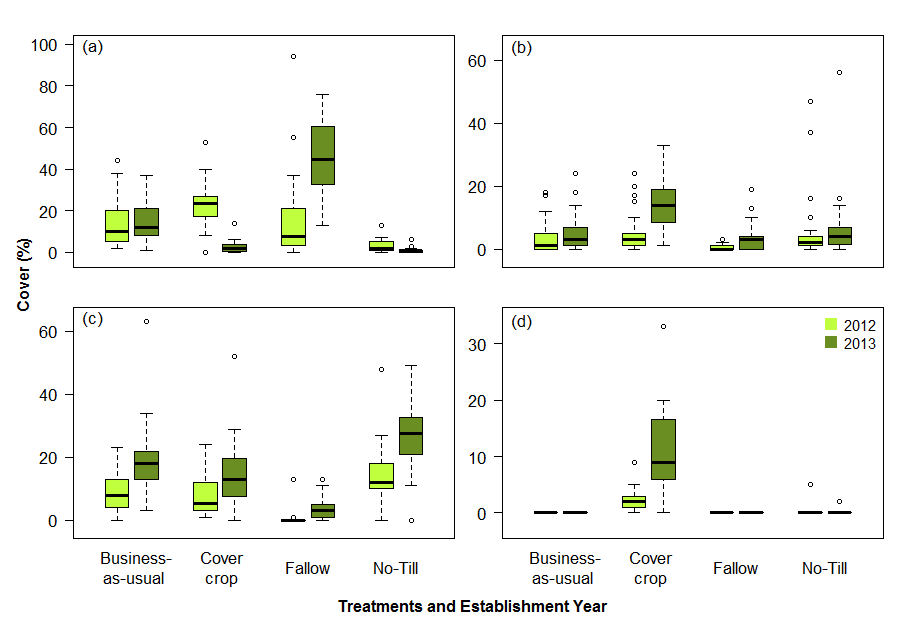
For species cover and composition, an increase in cover and a shift towards perennial species, and particularly perennial grasses, was observed for all establishment systems over the first two years 2012 and 2013 (Figure 7). This trend is likely to extend with perennial grasses dominating over time. Fallow plots were highly dominated by annuals during both years with cover of annuals increasing rapidly in the second year. Notably, perennial species were still only present at a low cover in second season. Unlike fallow, the no-till system was highly dominated by perennial species with a high percentage of quackgrass. These plots seem to develop quickly to grass dominated communites. Interestingly, quackgrass was associated with the conventional tillage system business-as-usual as well as with the reduced tillage system no-till. Repetitive mechanical tillage in the conventional system breaks up the rhizomatous root system of quackgrass and spreads the weed whereas in the reduced tillage system the increased soil moisture may favor the growth of quackgrass. The control business-as-usual plots were represented by nearly the same percentage of annual and perennial species but also seem to evolve to perennial dominated communities. Species composition in the cover crop plots was more diverse in the first year (data not shown) but seem to follow the described trend with fewer and mostly perennial species dominating in the second year. Establishment of the cover crops was poor in the first year with cover increasing in the second year.
|
Figure 7. Mean percent understory cover for a) annual forbs, b) perennial forbs, c) perennial grasses, and d) cover crops by treatment and establishment year. Boxplots present the median and interquartile range (quartiles 1-3) of fifteen blocks.
Microclimate and Resource Availability
Prior to multivariate analyses, correlation analysis was used to reduce the high number of predictor variables, including above- and belowground environmental and understory variables (Table 4), to those that were highly correlated with the response variable (seedling growth) but mutually uncorrelated. Among others, PAR transmittance showed the highest correlation with seedling growth why the following section focuses on differences in PAR transmittance among treatments.
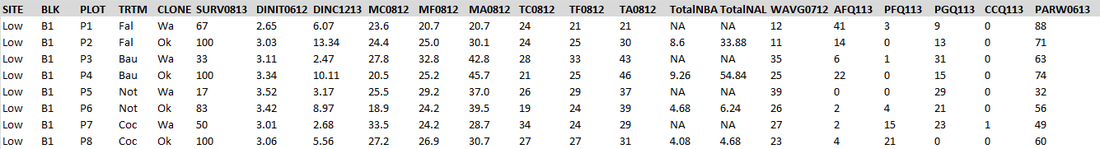
Table 4. Sample data table showing environmental measurements.
The vegetation composition as affected by the different control methods showed an effect on PAR transmittance (relative proportion of PAR transmitted to a) the weeds by the trees and b) the vertical midpoint of the tree crown portion shaded by weeds to the measure taken above the vegetation (Figure 8).
At the start of the growing season. and throughout, tree saplings in the fallow treatment intercepted a greater portion of available light than do the trees in the other treatments (Figure 8 a). Regarding weed interception of light, a decrease in PAR from early season to mid-season was observed for the treatments consisting mostly of annuals, that built up biomass thereby reducing PAR transmission (Fallow and Cover crop) with the Fallow treatment showing the highest PAR transmission early in the season compared to all other treatments (Figure 8b). This trend was not observed for both business-as-usual and no-till which showed very stable PAR transmission over time; this could be caused by a standing litter cover collapse rate comparable to the new growth cover gains (Figure 8b). The high increase in PAR transmission at the end of the growing season in both cover crop and no-till plots was caused by mowing the plots prior to light assessments (Figure 8b).

Figure 8. PAR transmittance (relative proportion of PAR transmitted to a) the weeds by the trees and b) the vertical midpoint of the tree crown portion shaded by weeds to the measure taken above the vegetation.
